Stats and the Chart
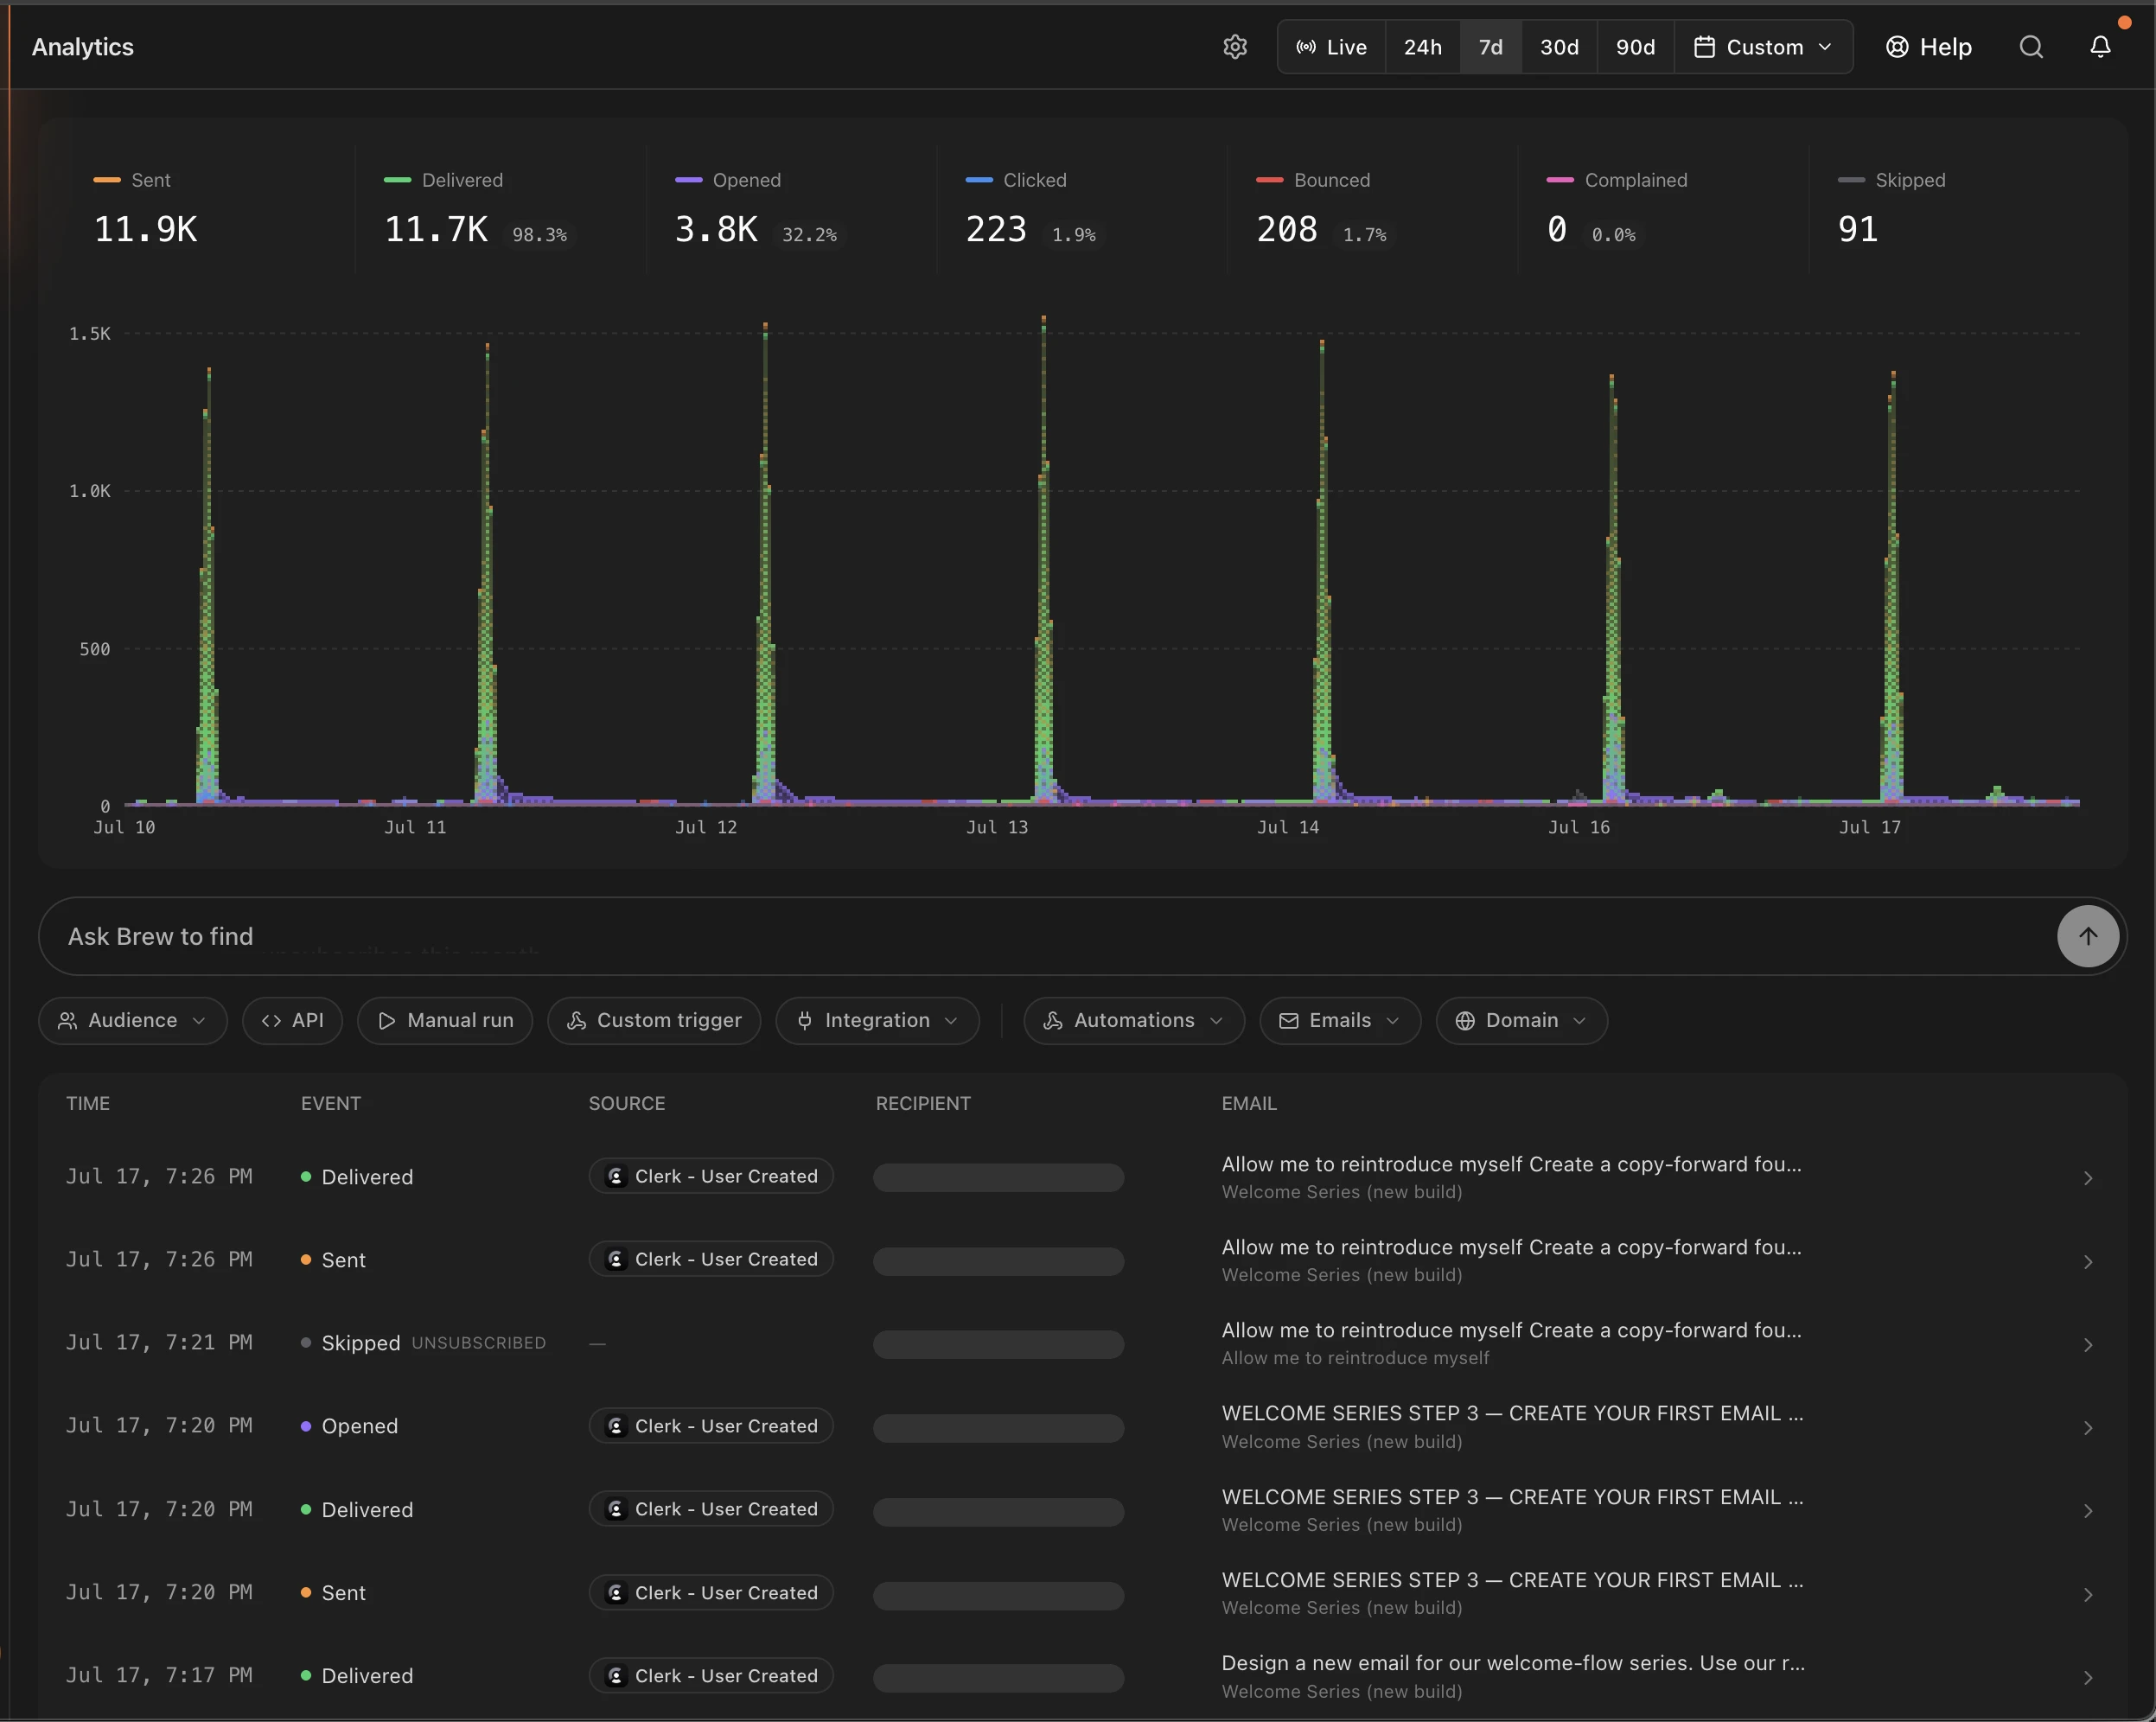
The top of the page shows seven headline stats for the selected window, each with its rate where one applies:
Below the stats, the chart plots event volume over time, color-coded to match the stat tiles, so a send spike, its delivery, and the engagement tail that follows are all visible in one place.
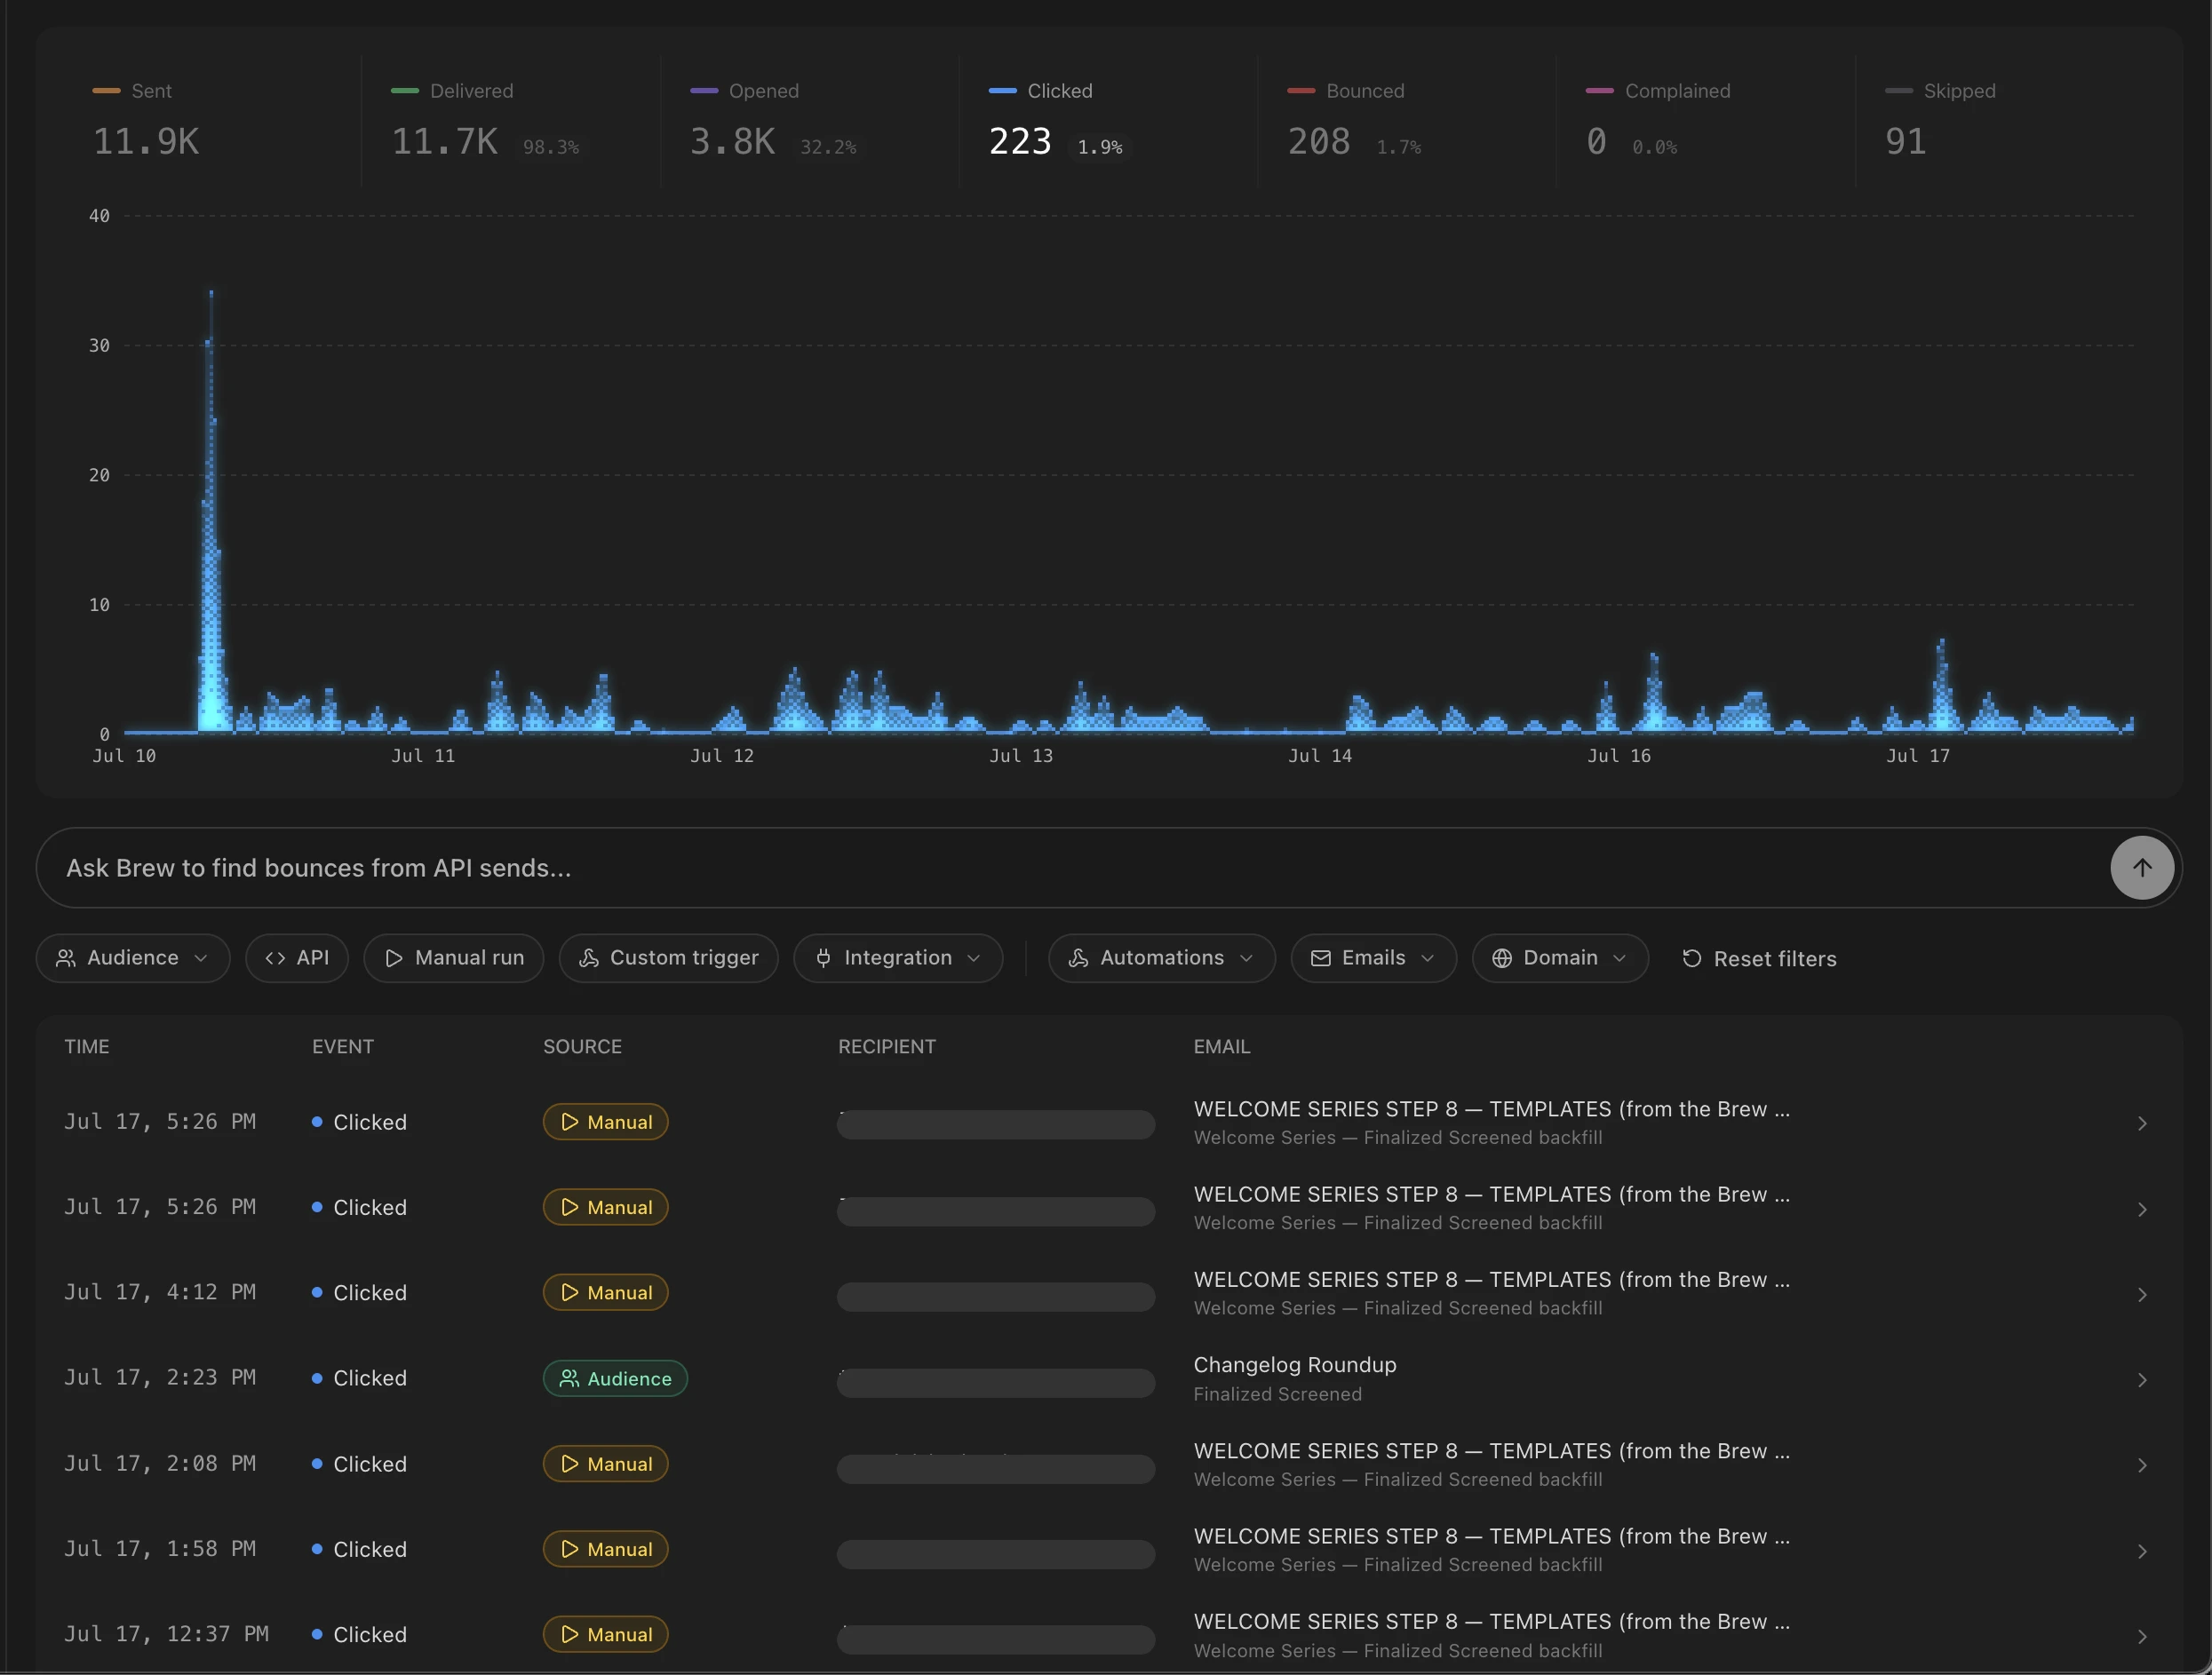
Each stat tile is also a filter. Click one, Clicked for example, and the chart and the event log narrow to that event type until you click it again.
Time Ranges and Live Mode
The controls in the top right set the window for everything on the page, stats, chart, and log alike:- Live. Streams events as they happen. Use it to watch an in-progress send land.
- 24h / 7d / 30d / 90d. Fixed windows.
- Custom. Pick any date range.
The Event Log
The bottom half of the page is a single stream of every email event: sent, delivered, opened, clicked, bounced, complained, and skipped (with the reason, such as unsubscribed). Automation steps, trigger fires, API sends, and one-off emails all land in the same log.
There are two ways to narrow the log:
- Filters. The chip row above the log filters by Audience, API, Manual run, Custom trigger, Integration, Automations, Emails, and Domain. Active filters show as highlighted chips you can remove individually, or clear all at once with Reset filters.
- Ask Brew. The search bar above the filters takes plain language. Describe what you’re looking for, like “welcome emails that bounced this week”, and Brew translates it into the matching filters.
Event Details
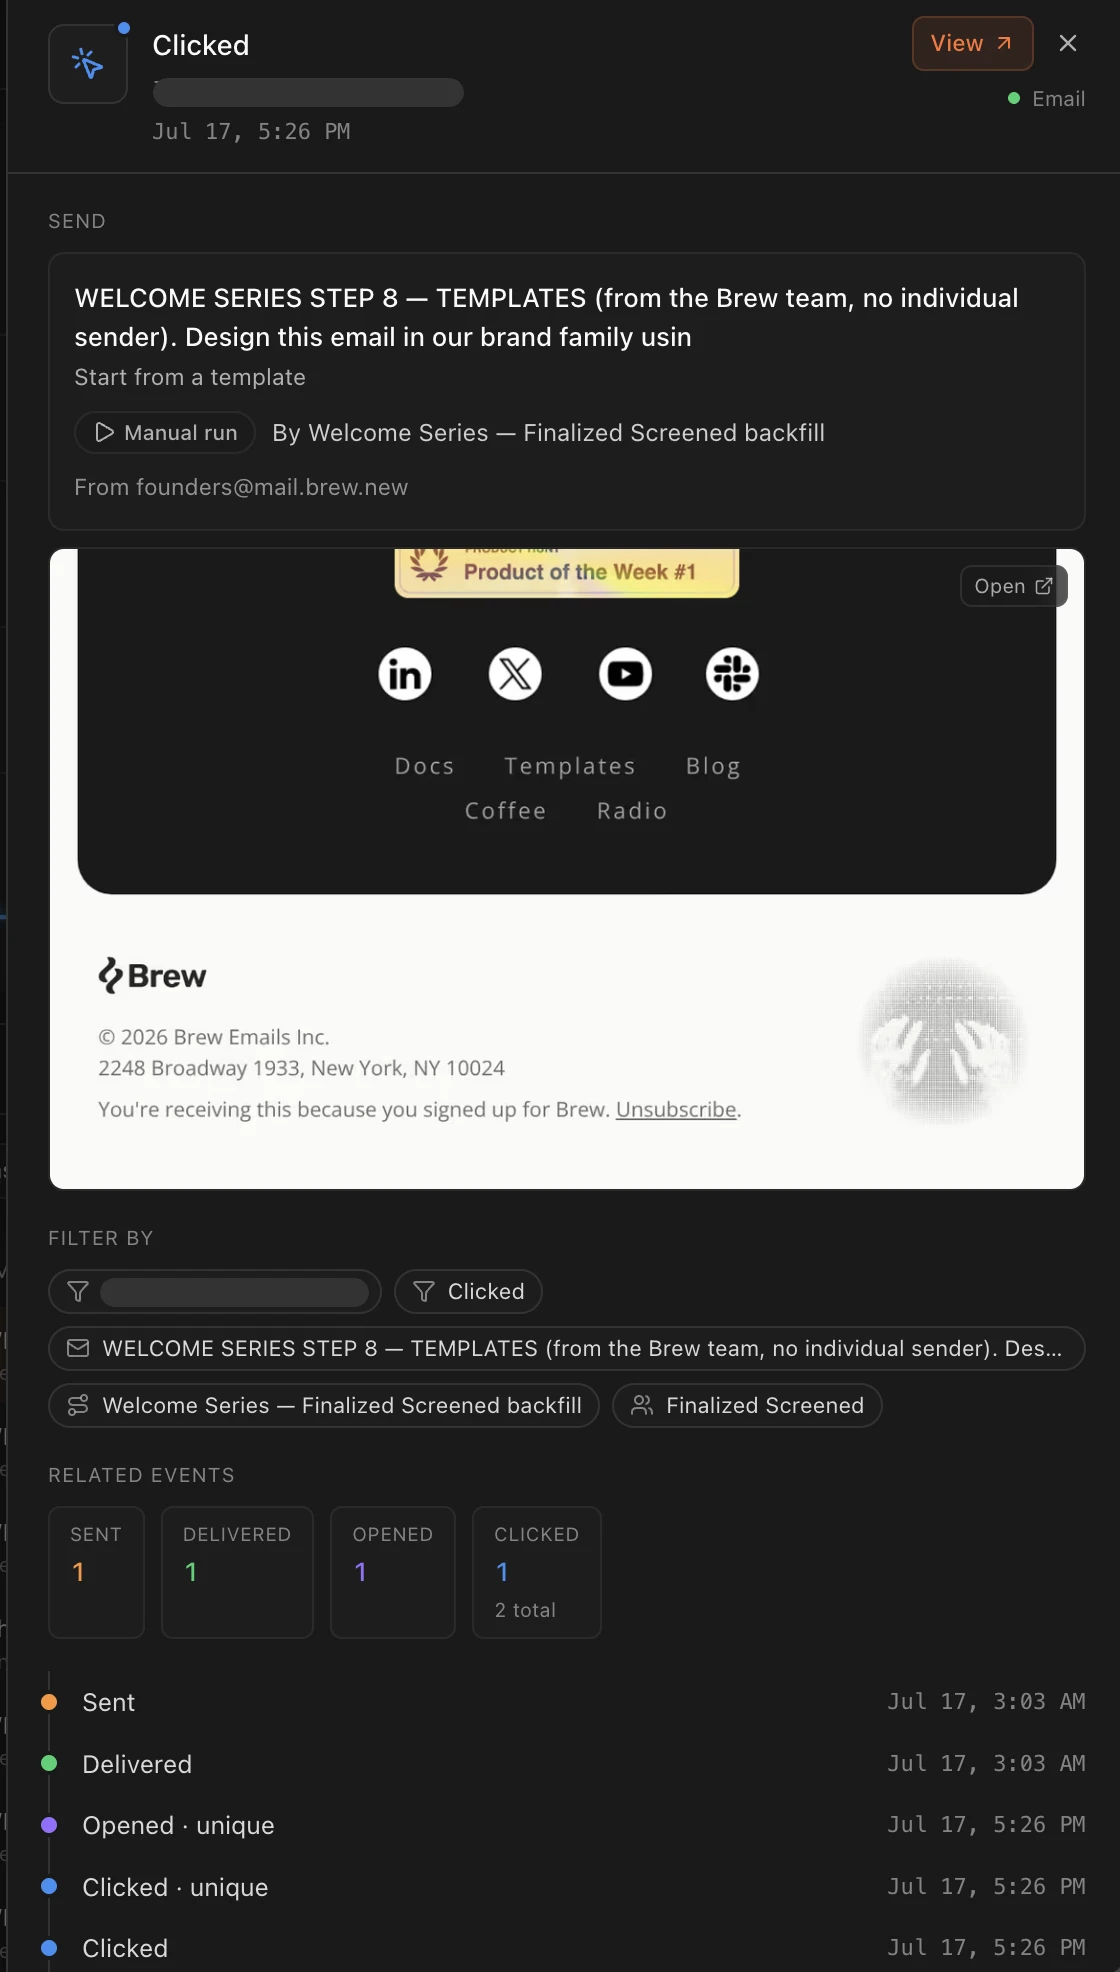
Click any row for the full story of that event:- The email itself. A rendered preview of what the recipient received, with a link to open it.
- Where it came from. The automation or integration that produced the send, the From address, and a View run link that jumps to the automation run behind it.
- Filter by. One-click chips for the recipient, event type, email, automation, or audience. Each one pivots the log to everything matching, so you can go from one bounce to every event for that contact in a click.
- Related events. Sent, Delivered, Opened, and Clicked counts for that recipient and send, with a timeline underneath. Unique events are marked, and repeats are counted, so a recipient who clicked twice shows one unique click and two total.
- Details, metadata, and debug payload. The recipient and From address with copy buttons, plus collapsible Metadata and Debug Payload sections. For trigger-driven sends, the payload is the actual event data the integration delivered, which makes this the fastest way to debug a trigger.
Clicks Get Two Extras
For click events, the detail panel also shows:- Activity. The exact link the recipient clicked.
- Location. A map of where the click happened, down to city and country. Geographic data is available on click events only.
Where the Numbers Come From
Every metric on the page is derived from sends and their events.- A send is one delivery of a design. An email records a single send for the whole audience; an automation records one send per recipient. Both kinds share the same view.
- Each send accumulates events as it moves through the pipeline (sent → delivered → opened → clicked, plus bounces, complaints, and unsubscribes). Every event is attached to the send that produced it, so a recipient’s open always traces back to the exact send and design they received.
- Rolled-up totals are computed per send from those events, then aggregated across the window you’re viewing.