August 2026 · Available on all plans. For current analytics behavior, see Reading Analytics.
What Shipped
Analytics used to be separate per-email, per-automation, and per-event screens. Now it’s one system with three layers:- A home page listing everything you’ve sent
- A detail page for every item
- An event log behind every number
Two Tabs, One Rule
The list splits into two tabs:- Audience is every one-time send: one-off Emails and manual-audience runs. Stats are lifetime.
- Automation is every live, event-triggered flow. Stats cover the last 14 days.
Every Email in a Flow, Measured
The automation page is where this pays off. The Email steps section lists every email in the flow, in order. Each one carries its own sent, opened, and clicked, plus unsubscribes where they happened. Select steps to focus the metrics. A welcome email opening at 44% followed by a step at 31% tells you exactly where a sequence loses people, and which email to fix. One-time sends get their own page too. It shows sending identity, all-time stats, the dispatch record, and the rendered email next to the numbers it earned.Events, One Click Away
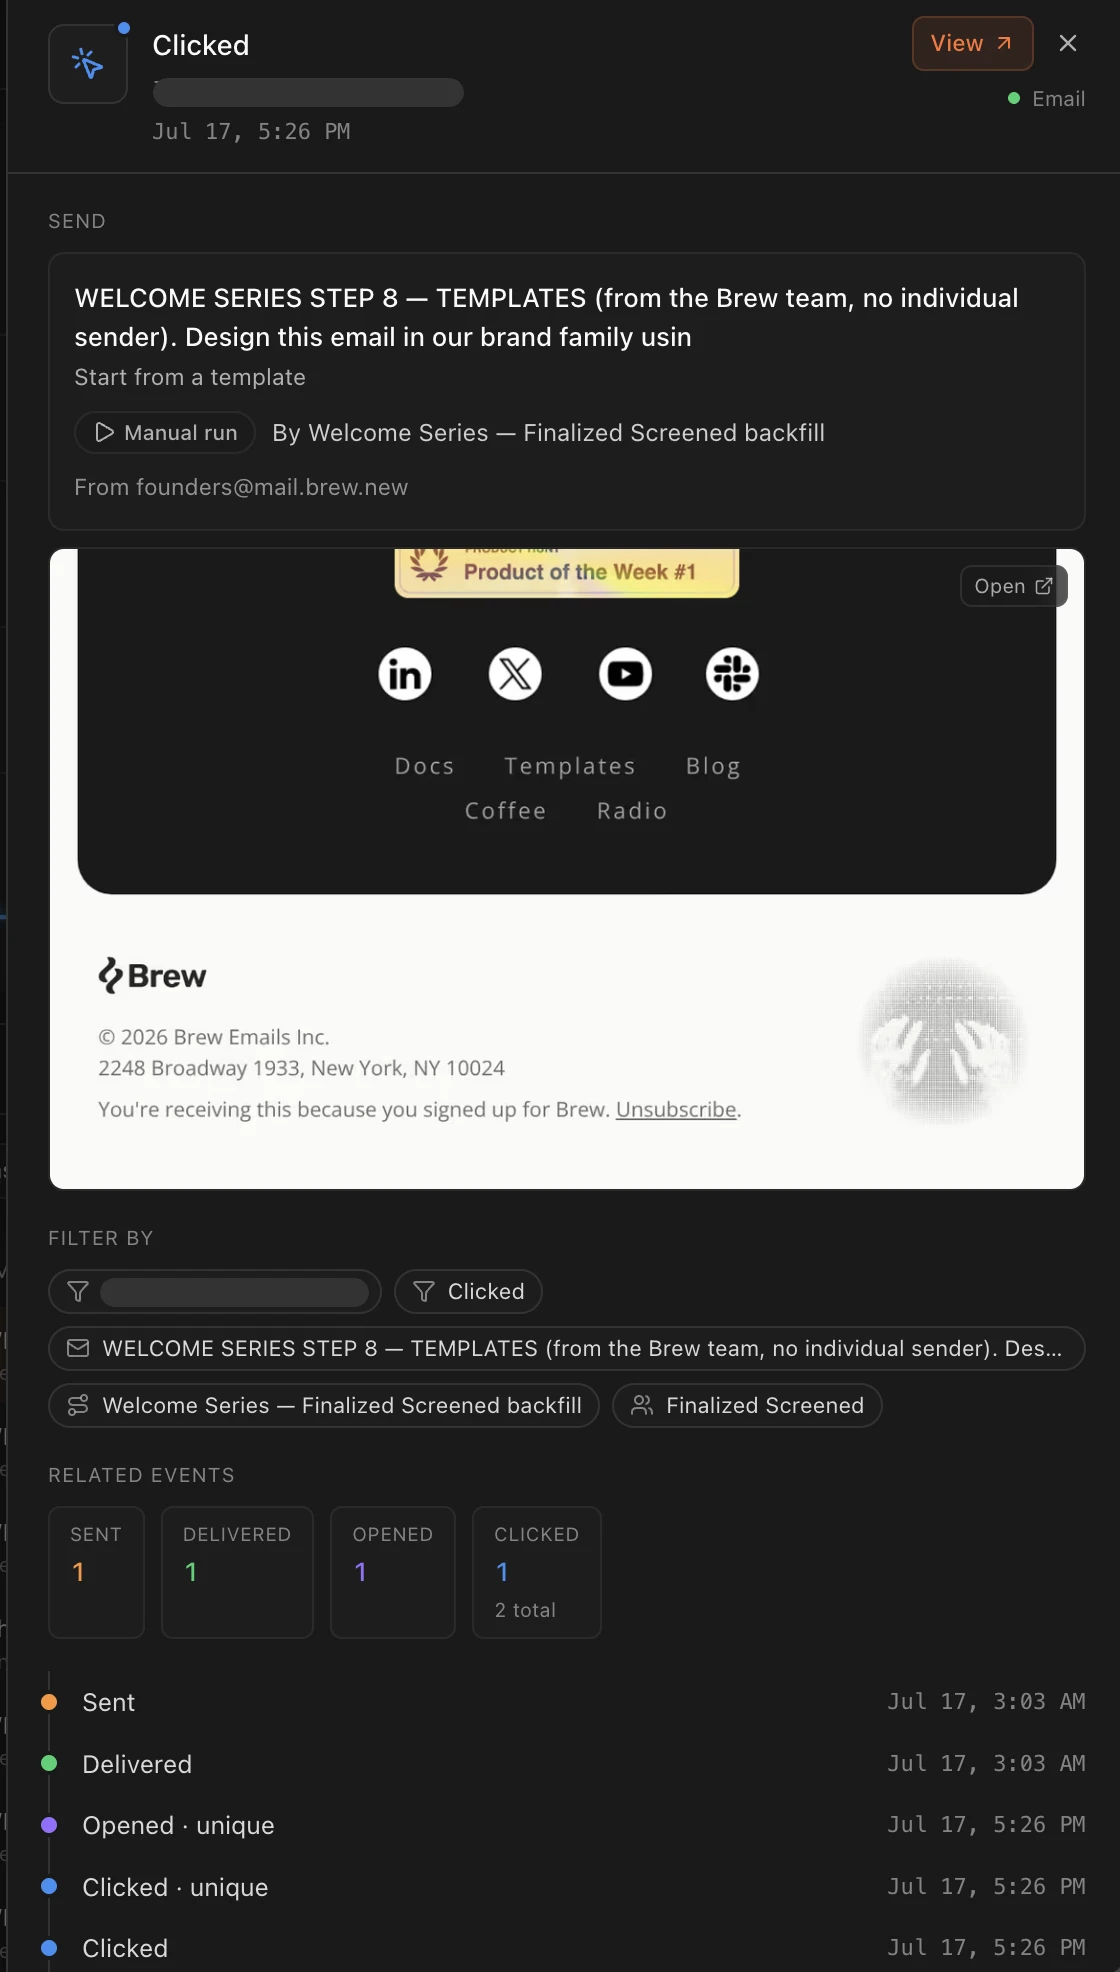
Every individual open, click, and bounce lands in the Events log. The pulse icon on any detail page opens it filtered to that item, so “which specific people opened this?” is one click from any number. Each row opens a detail panel: the rendered email, the source, related events, and the debug payload. Click events also carry the exact link and a location map.